| Particulars | FY 2019 – 20 | FY 2020 – 21 | FY 2021 – 22 | FY 2022 – 23 | FY 2023 – 24 | FY 2024 – 25 |
|---|---|---|---|---|---|---|
| Income from operations | 1,39,87,928 | 1,01,35,758 | 13,913,712 | 22,276,676 | 25,744,440 | 31,272,184 |
| Other Income | 6,69,443 | 11,10,858 | 3,544,643 | 4,327,481 | 4,958,364 | 412,475 |
| Total Income | 1,46,57,371 | 1,12,46,616 | 17,458,355 | 26,604,157 | 30,702,804 | 31,684,659 |
| Profit Before Tax | 56,32,672 | 25,61,294 | 8,348,390 | 18,189,046 | 20,690,953 | 20,226,393 |
| Profit After Tax | 39,14,039 | 19,57,170 | 5,697,534 | 11,886,925 | 13,155,675 | 13,157,228 |
| Interest Margin (%) | 9 | 4 | 12 | 23 | 24 | 23 |
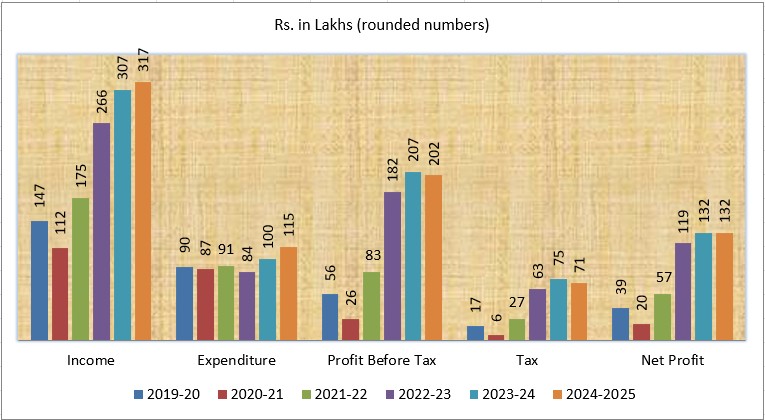
Balance Sheet and Profitability 2019 – 20 & 2020 – 21 &2021-22 & 2022-23 & 2023-24
(Rs. In Lakhs) (rounded numbers)
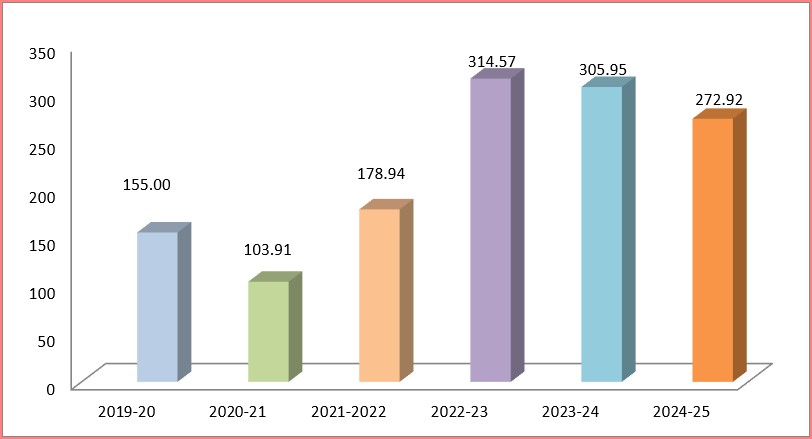
A sizeable growth has been achieved in comparison with previous financial year
Loan Purposes 2024 – 25
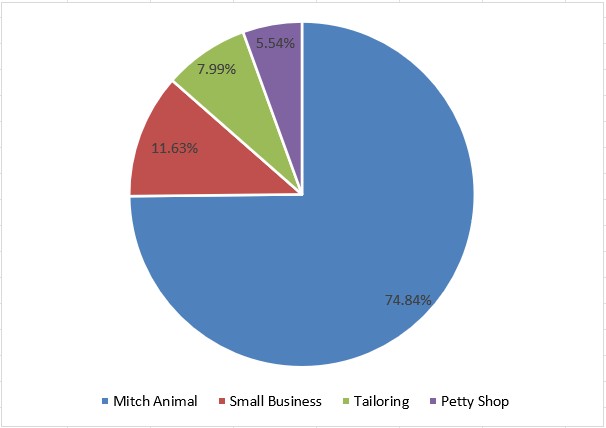
Predominantly income generation loans are disbursed for Agri allied businesses
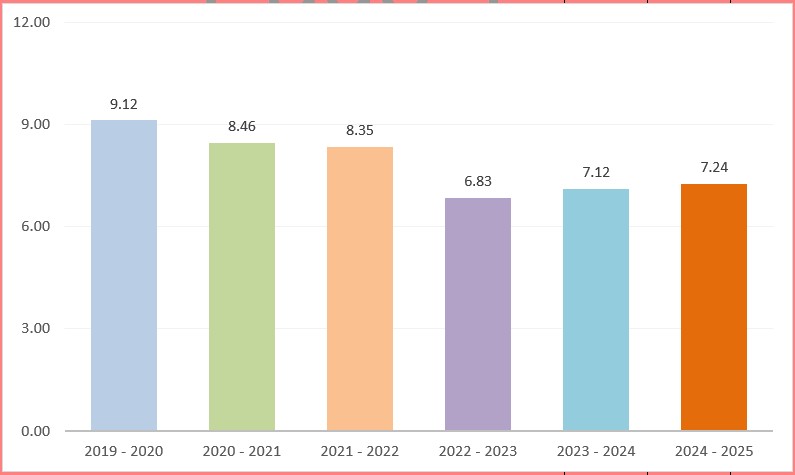
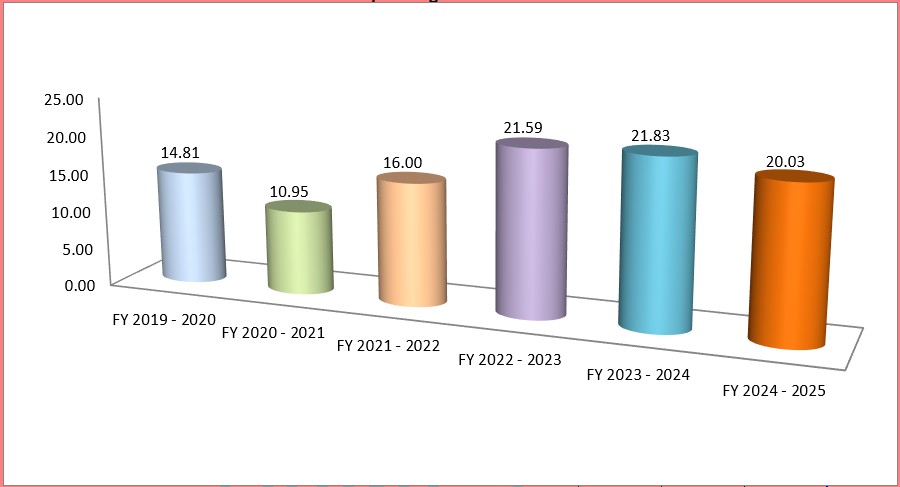
Operational Self Sufficiency
Operating Income Ratio
Operating Cost Ratio